40 minutes a day. Every day. For everyone.
Performance marketing managers at Hector send daily scorecards to their brand POCs — a snapshot of yesterday's and month-to-date ad metrics for each brand they manage. The process: open the ad platform, download data, copy figures into an Excel template, screenshot it, send it. Repeat for every brand.
For each scorecard: roughly 10 minutes. With 3–4 brands per person, that's 40 minutes of manual, repetitive work — before the actual work of the day begins. Across 20+ colleagues doing this daily, the scale of the problem became clear quickly.
The problem wasn't assigned. It was noticed.
From Excel screenshot to branded report
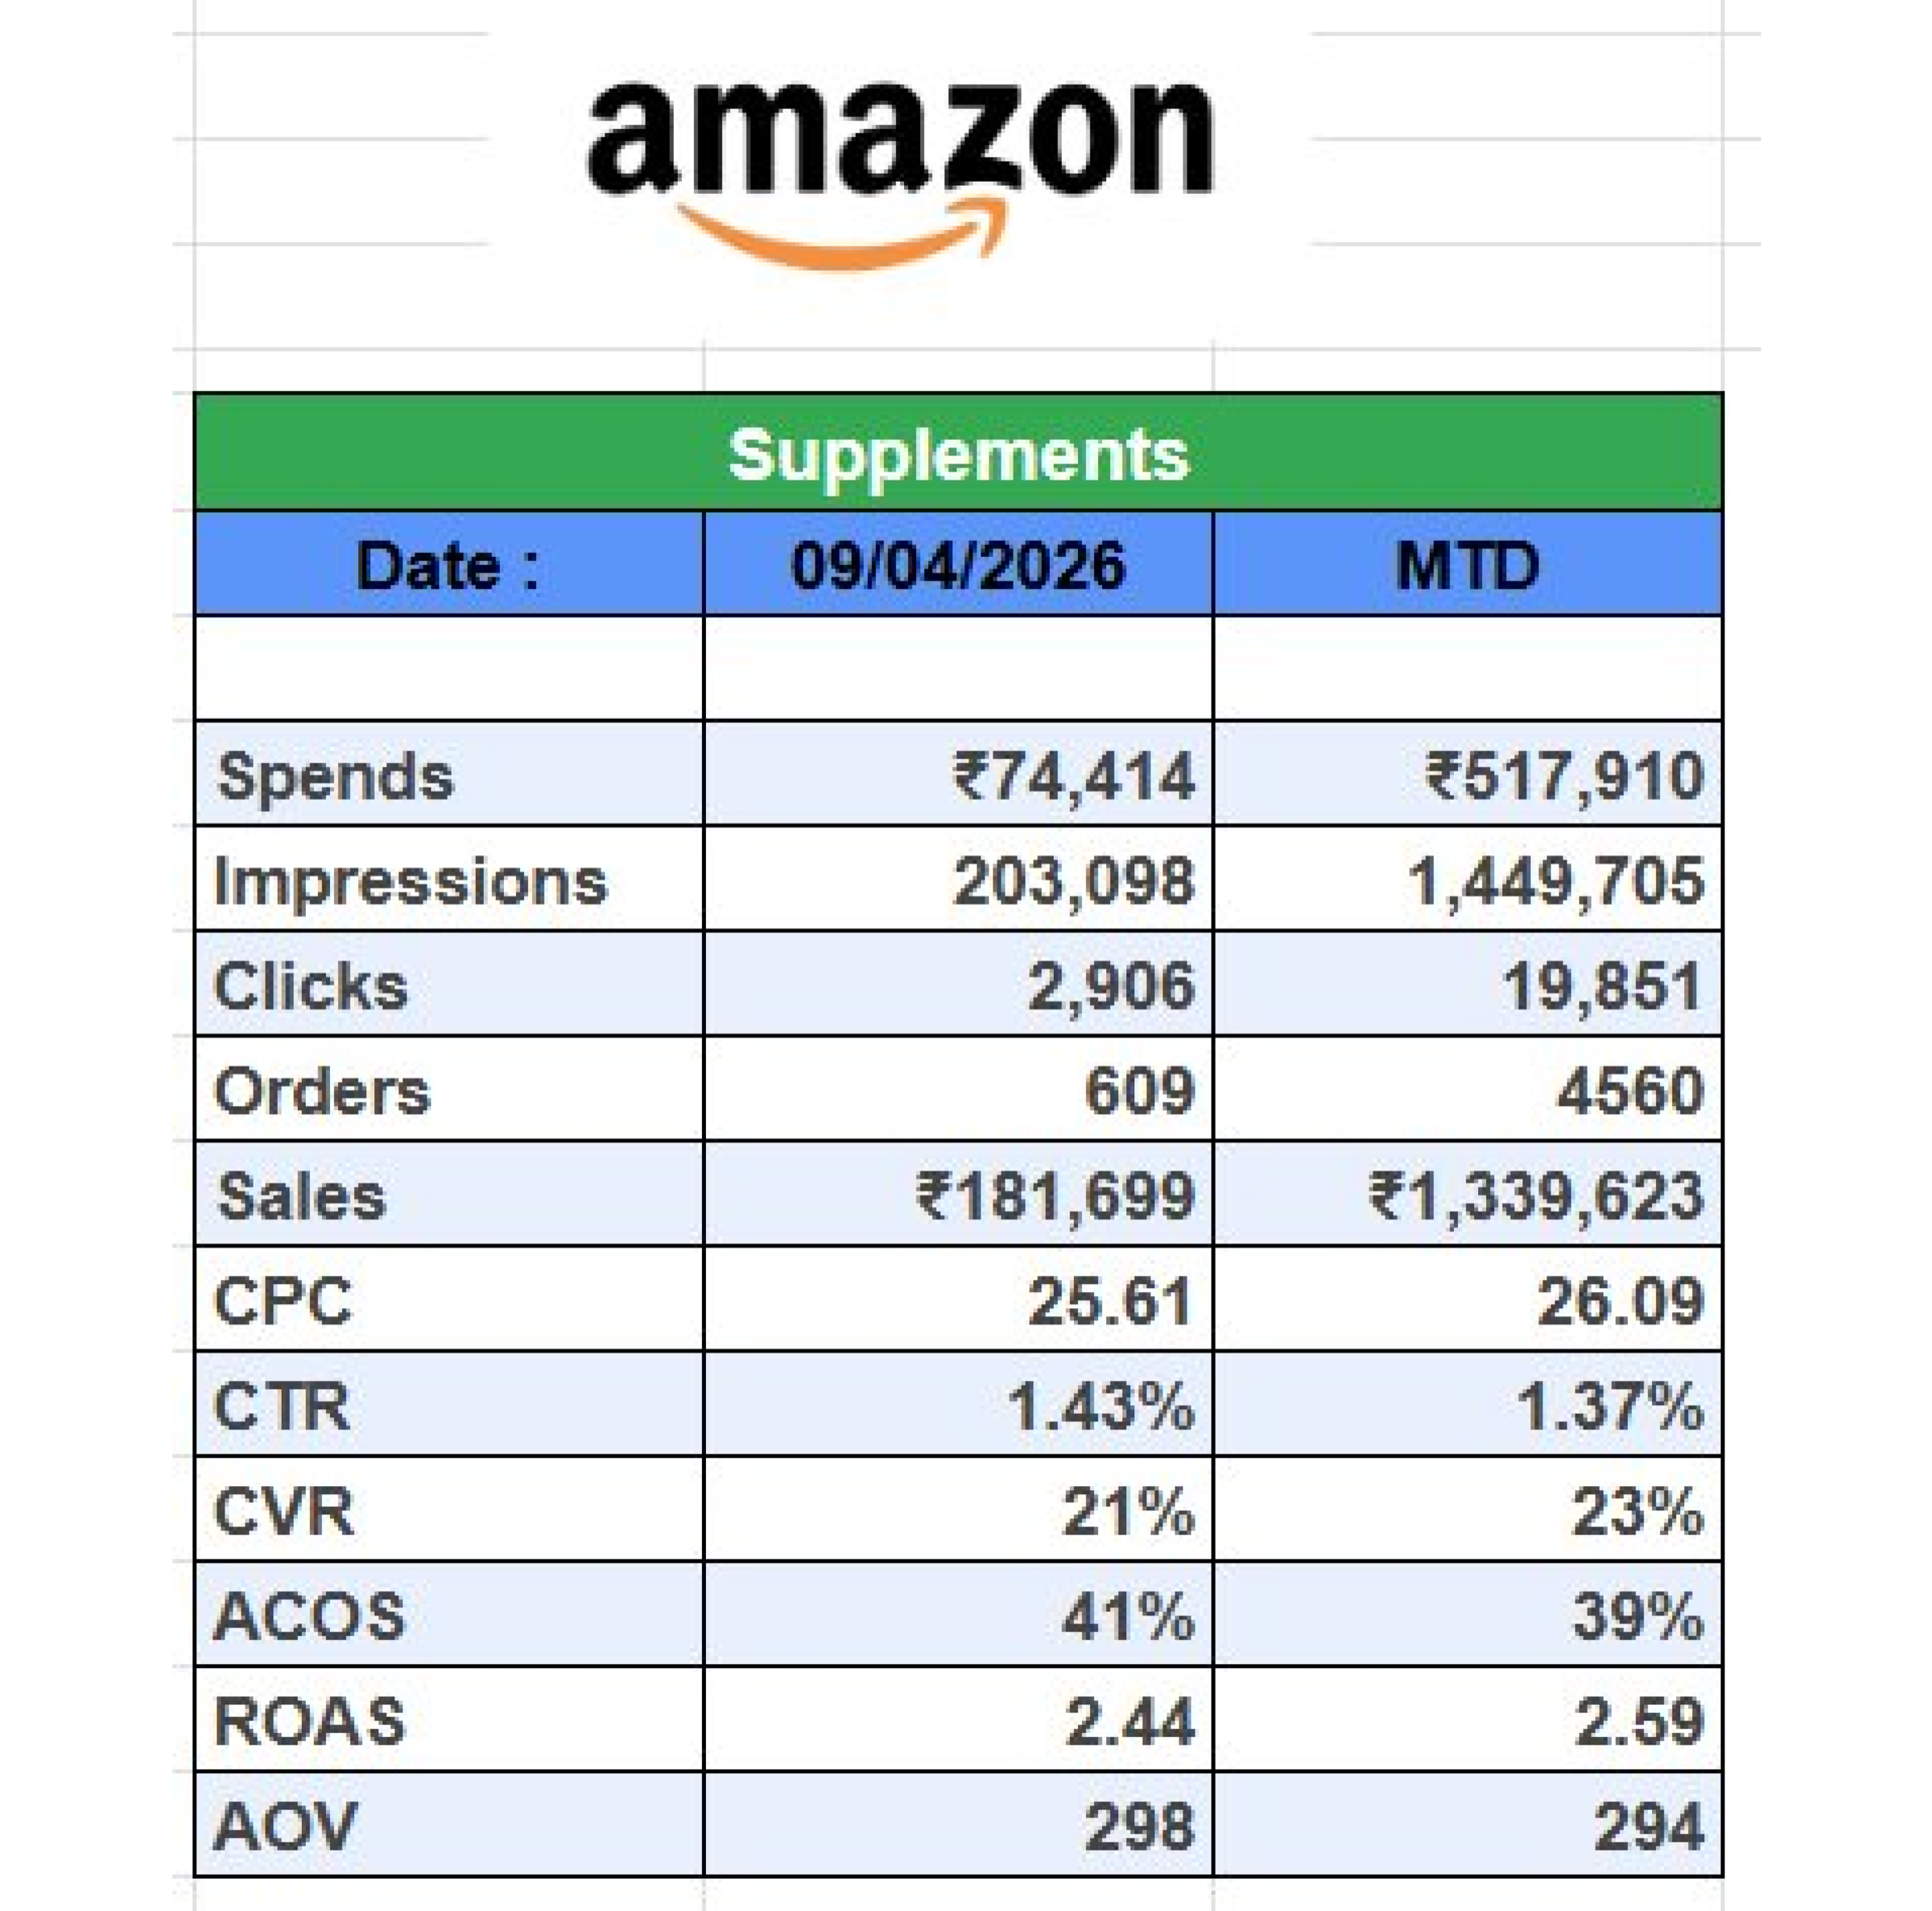
The existing scorecard was a manually built Excel sheet — brand name at the top, metrics in rows, two columns for daily and MTD figures. Once filled in, it was screenshotted and sent to the client POC. Functional, but time-consuming, unbranded, and entirely dependent on the person doing it correctly every time.
How it works
The tool accepts CSV exports directly from the ad platform — the same files the team was already downloading. Upload one or more files, assign each a date range label, enter the brand name, select the platform, apply any portfolio filters, choose which metrics to include. One click generates the report.
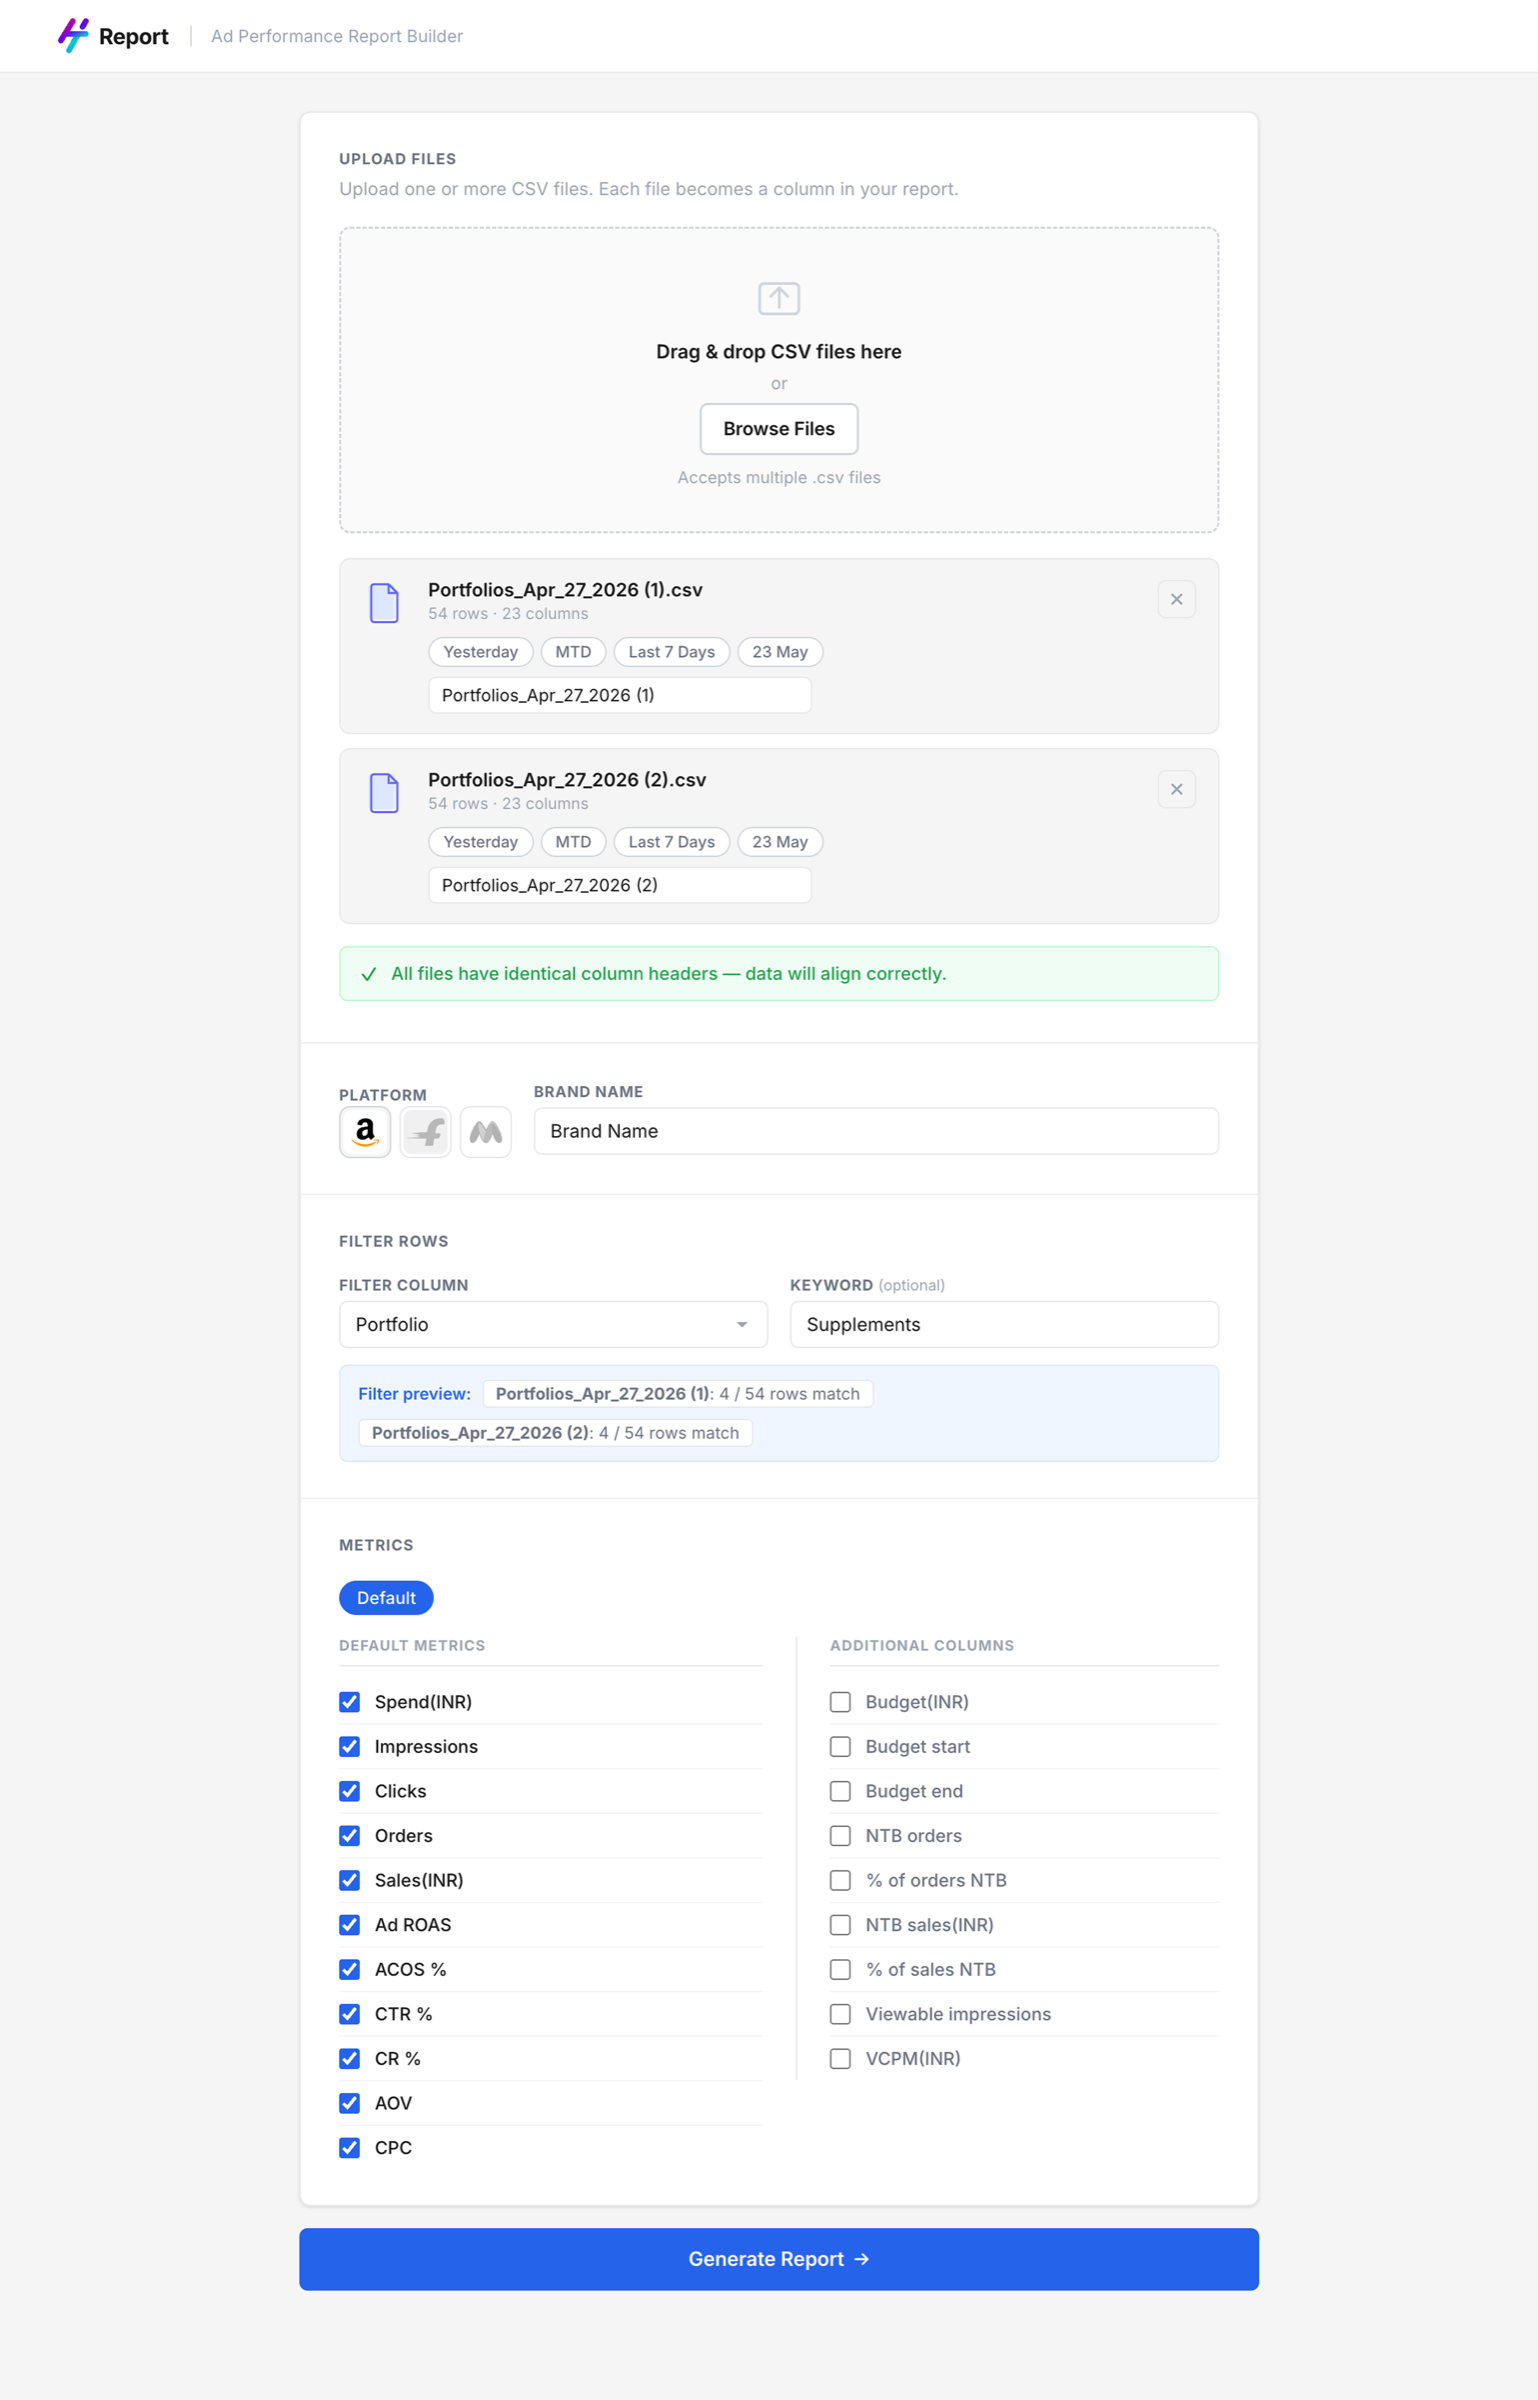
Input screen — CSV upload, date range detection, brand setup, metric selection
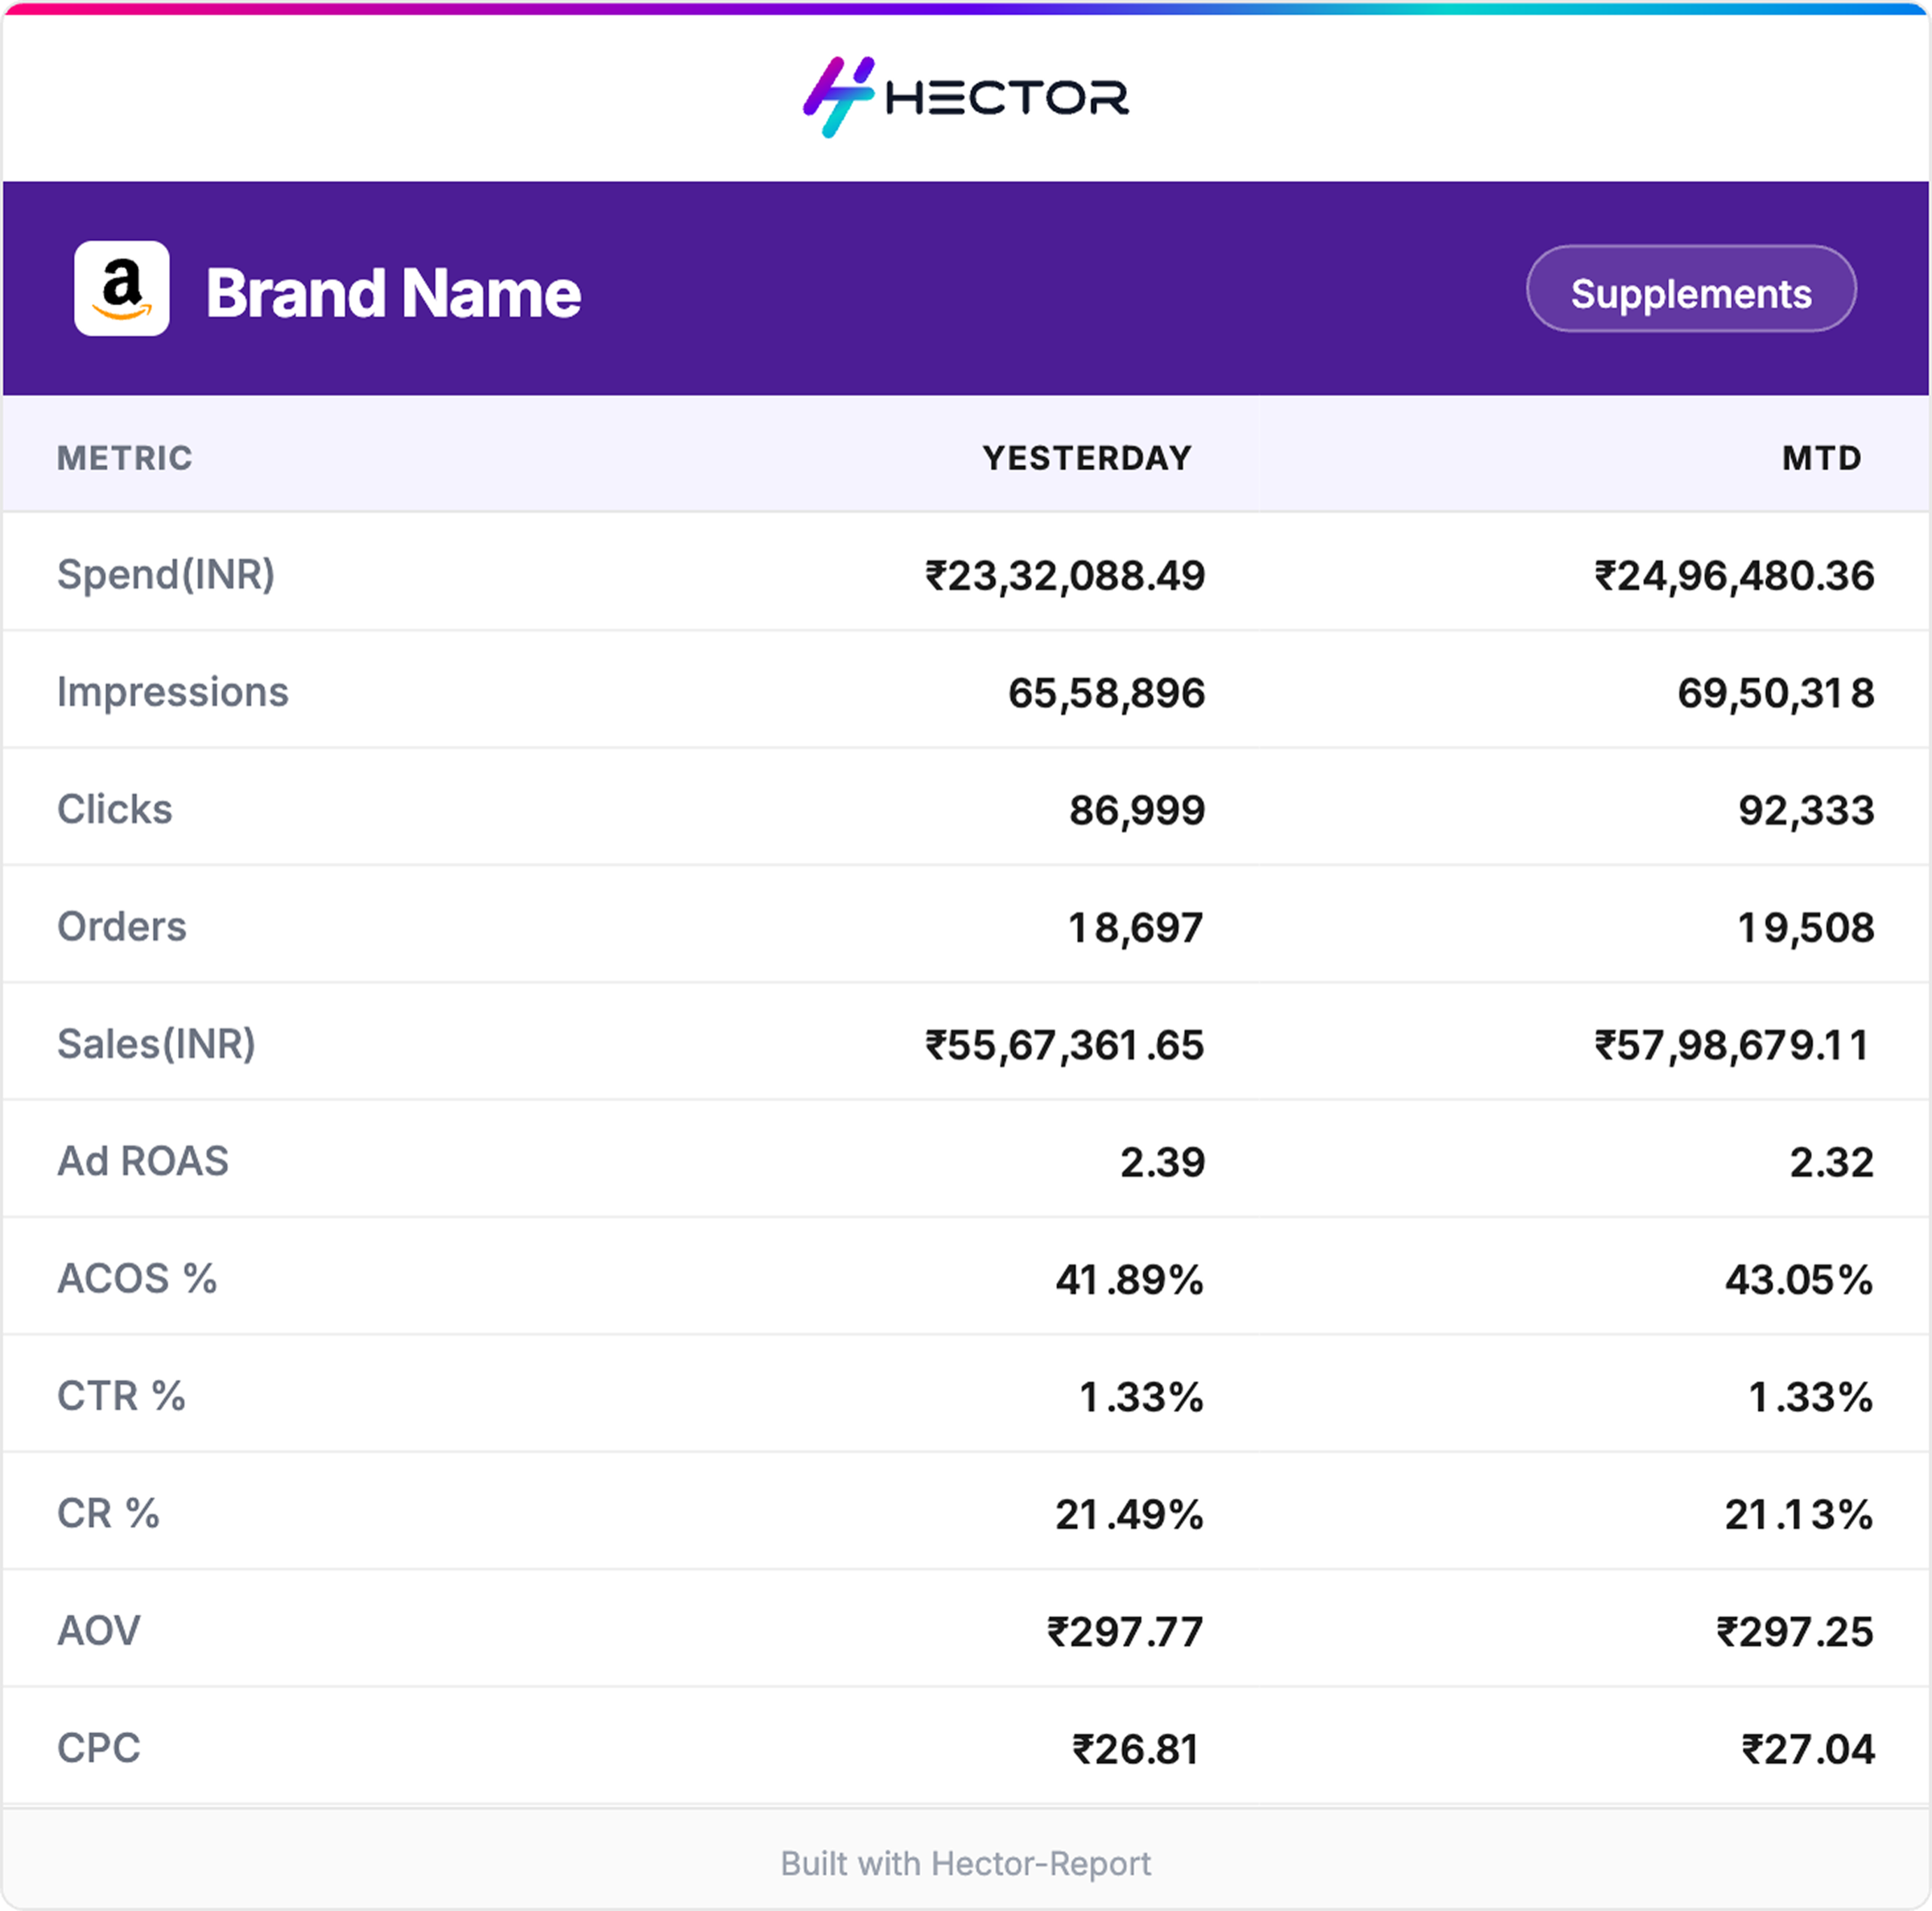
The output is a clean, Hector-branded performance card — downloadable as a PNG, ready to share directly with the client POC. No copy-pasting, no formatting, no screenshotting.
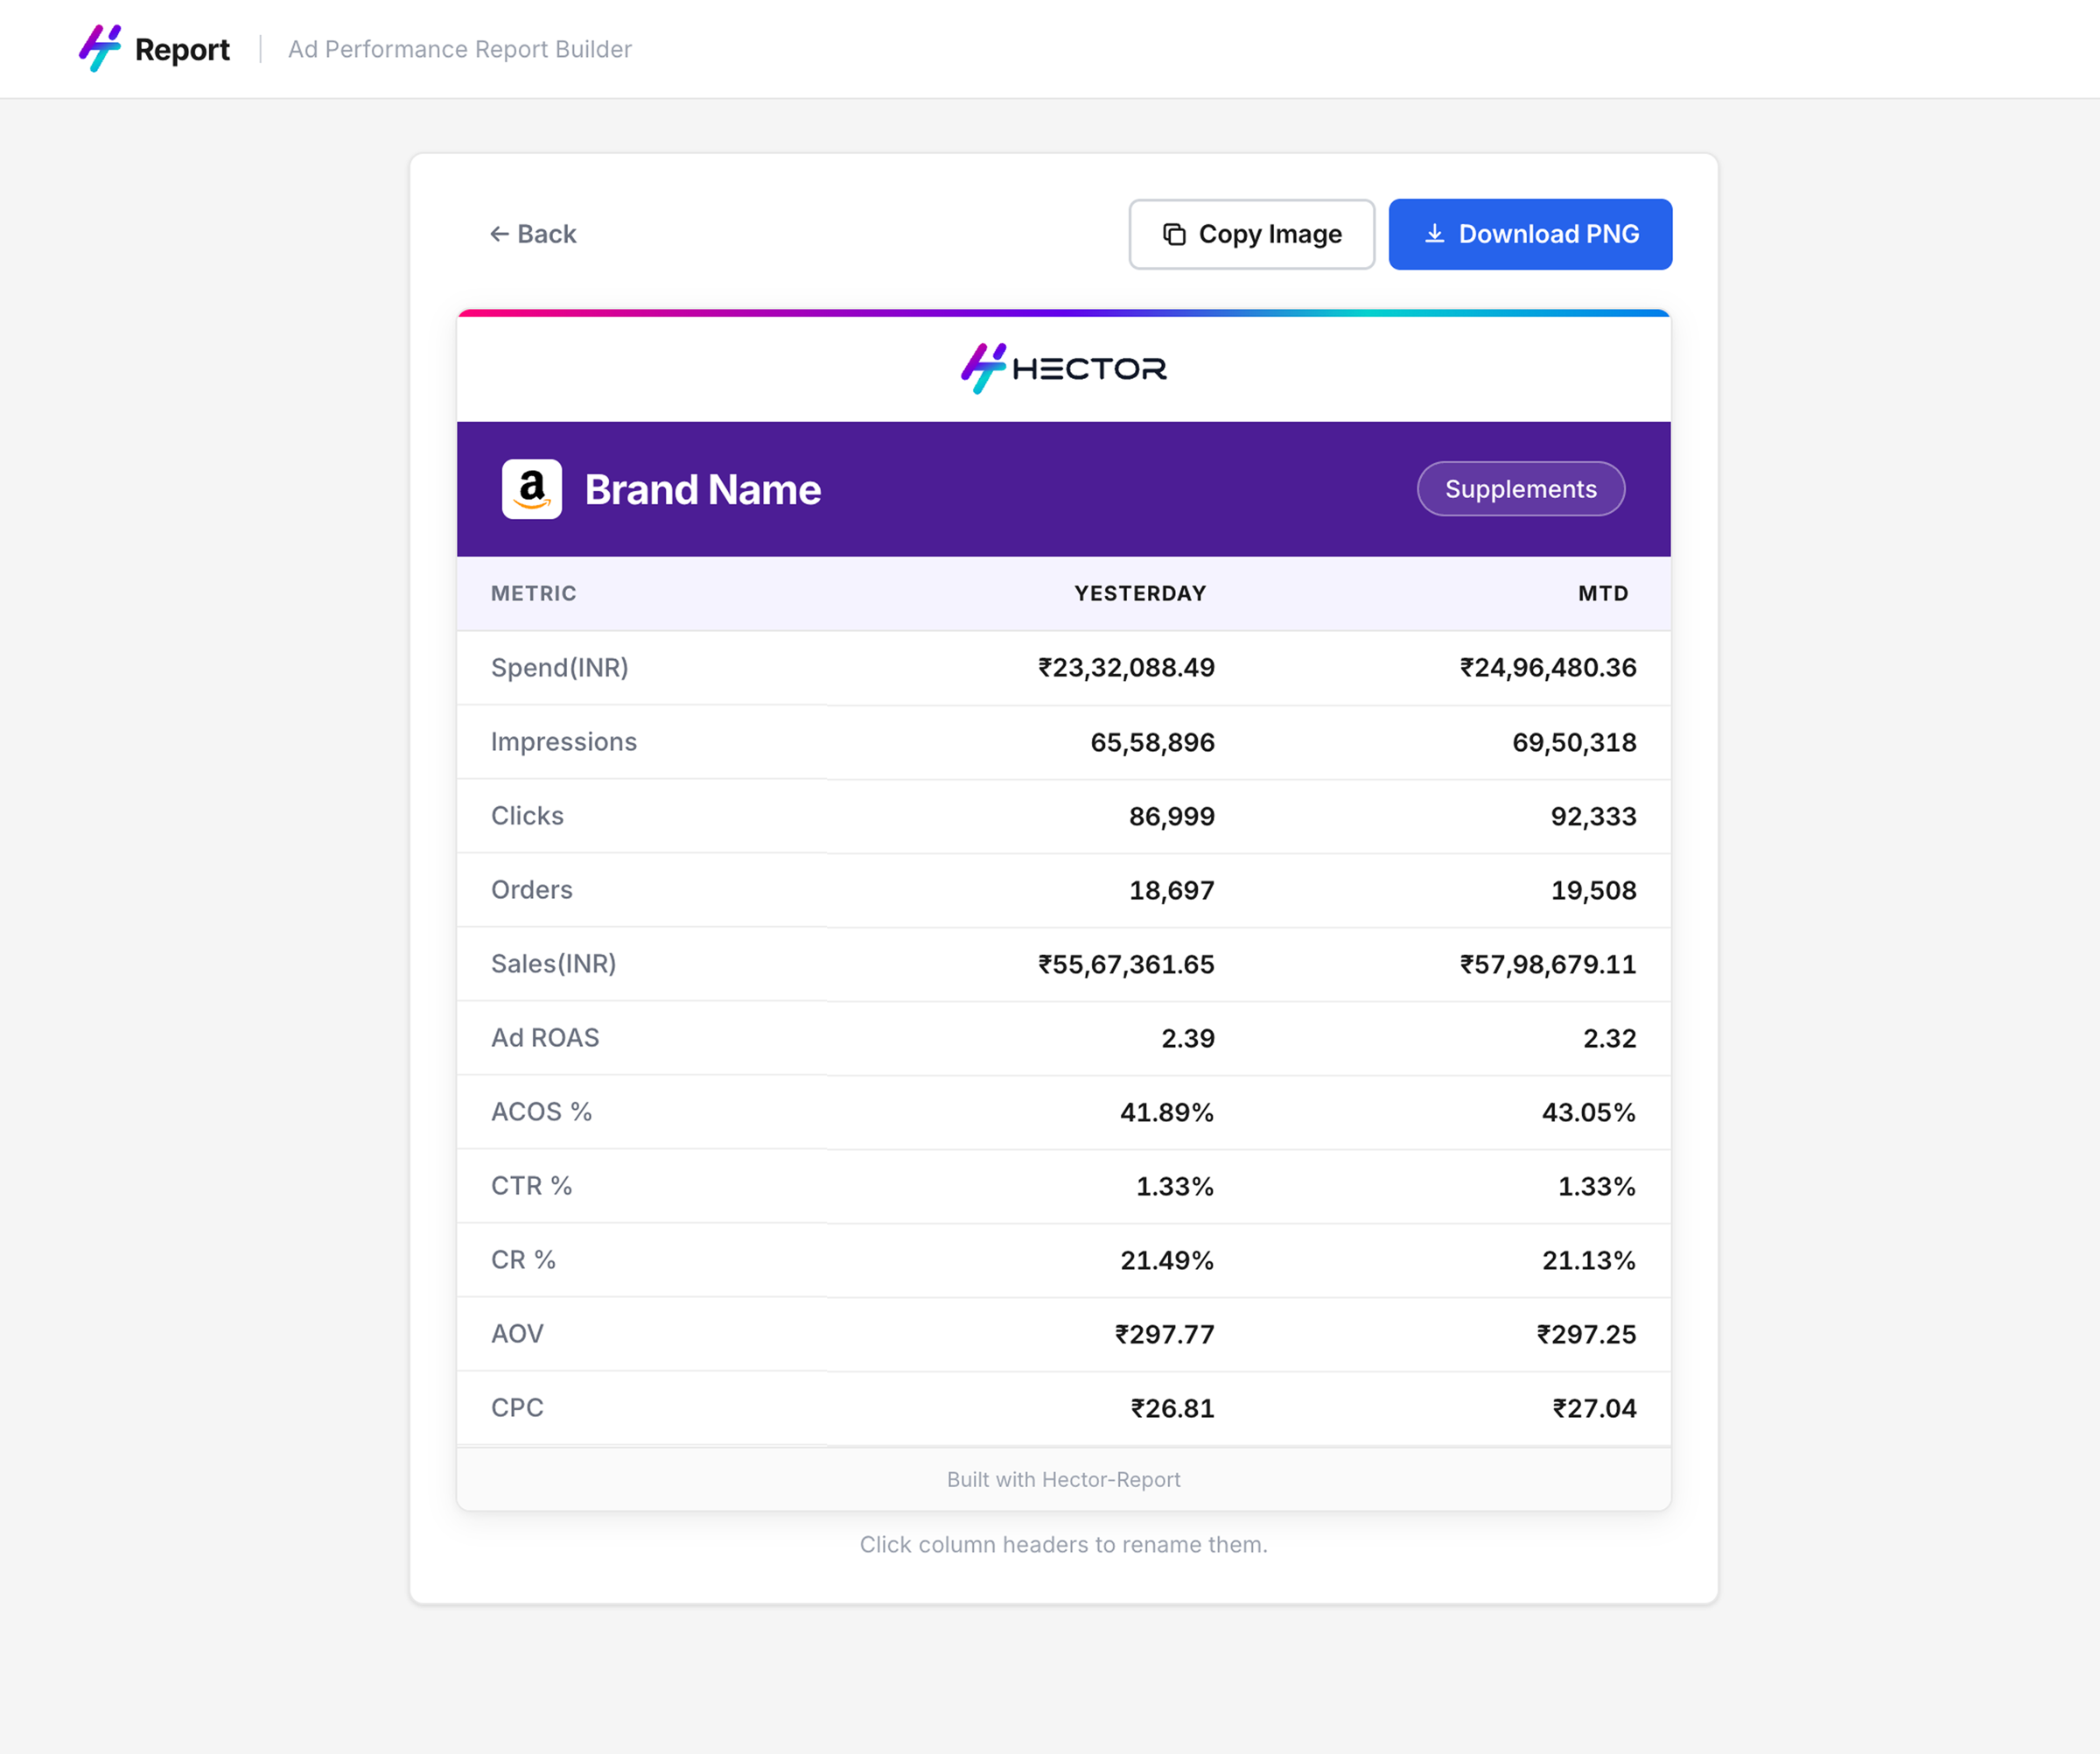
Generated report — preview and download PNG in one click
Every report that goes to a client POC now carries the Hector logo. A tool built to solve an internal problem became passive brand visibility with every send.
Built for one. Adopted by many.
The tool started with one colleague. Within weeks, the whole team had switched. Nobody asked them to — the output was visibly better and the time saving was immediate. Colleagues are now requesting support for additional platforms as their needs expand.
- A real problem identified through observation, not through a brief
- A working product built and shipped — not a prototype, not a concept
- Organic adoption across 20+ colleagues without any formal rollout
- Active expansion as new platform requests come in from the team
A different problem. Larger scale.
Performance marketing managers track daily spend against allocated budget across portfolios. At the start of each month, a total ad budget is split across portfolios, each with a Daily Run Rate (DRR) — the amount that needs to be spent each day to exhaust the budget by month end.
Actual spend never matches the plan exactly. Every day, the DRR recalculates. Every day, managers need to check which portfolios are on track, which need attention, and what the revised daily target is. All tracked manually — formulas in Excel, updated daily, across multiple brands and portfolios.
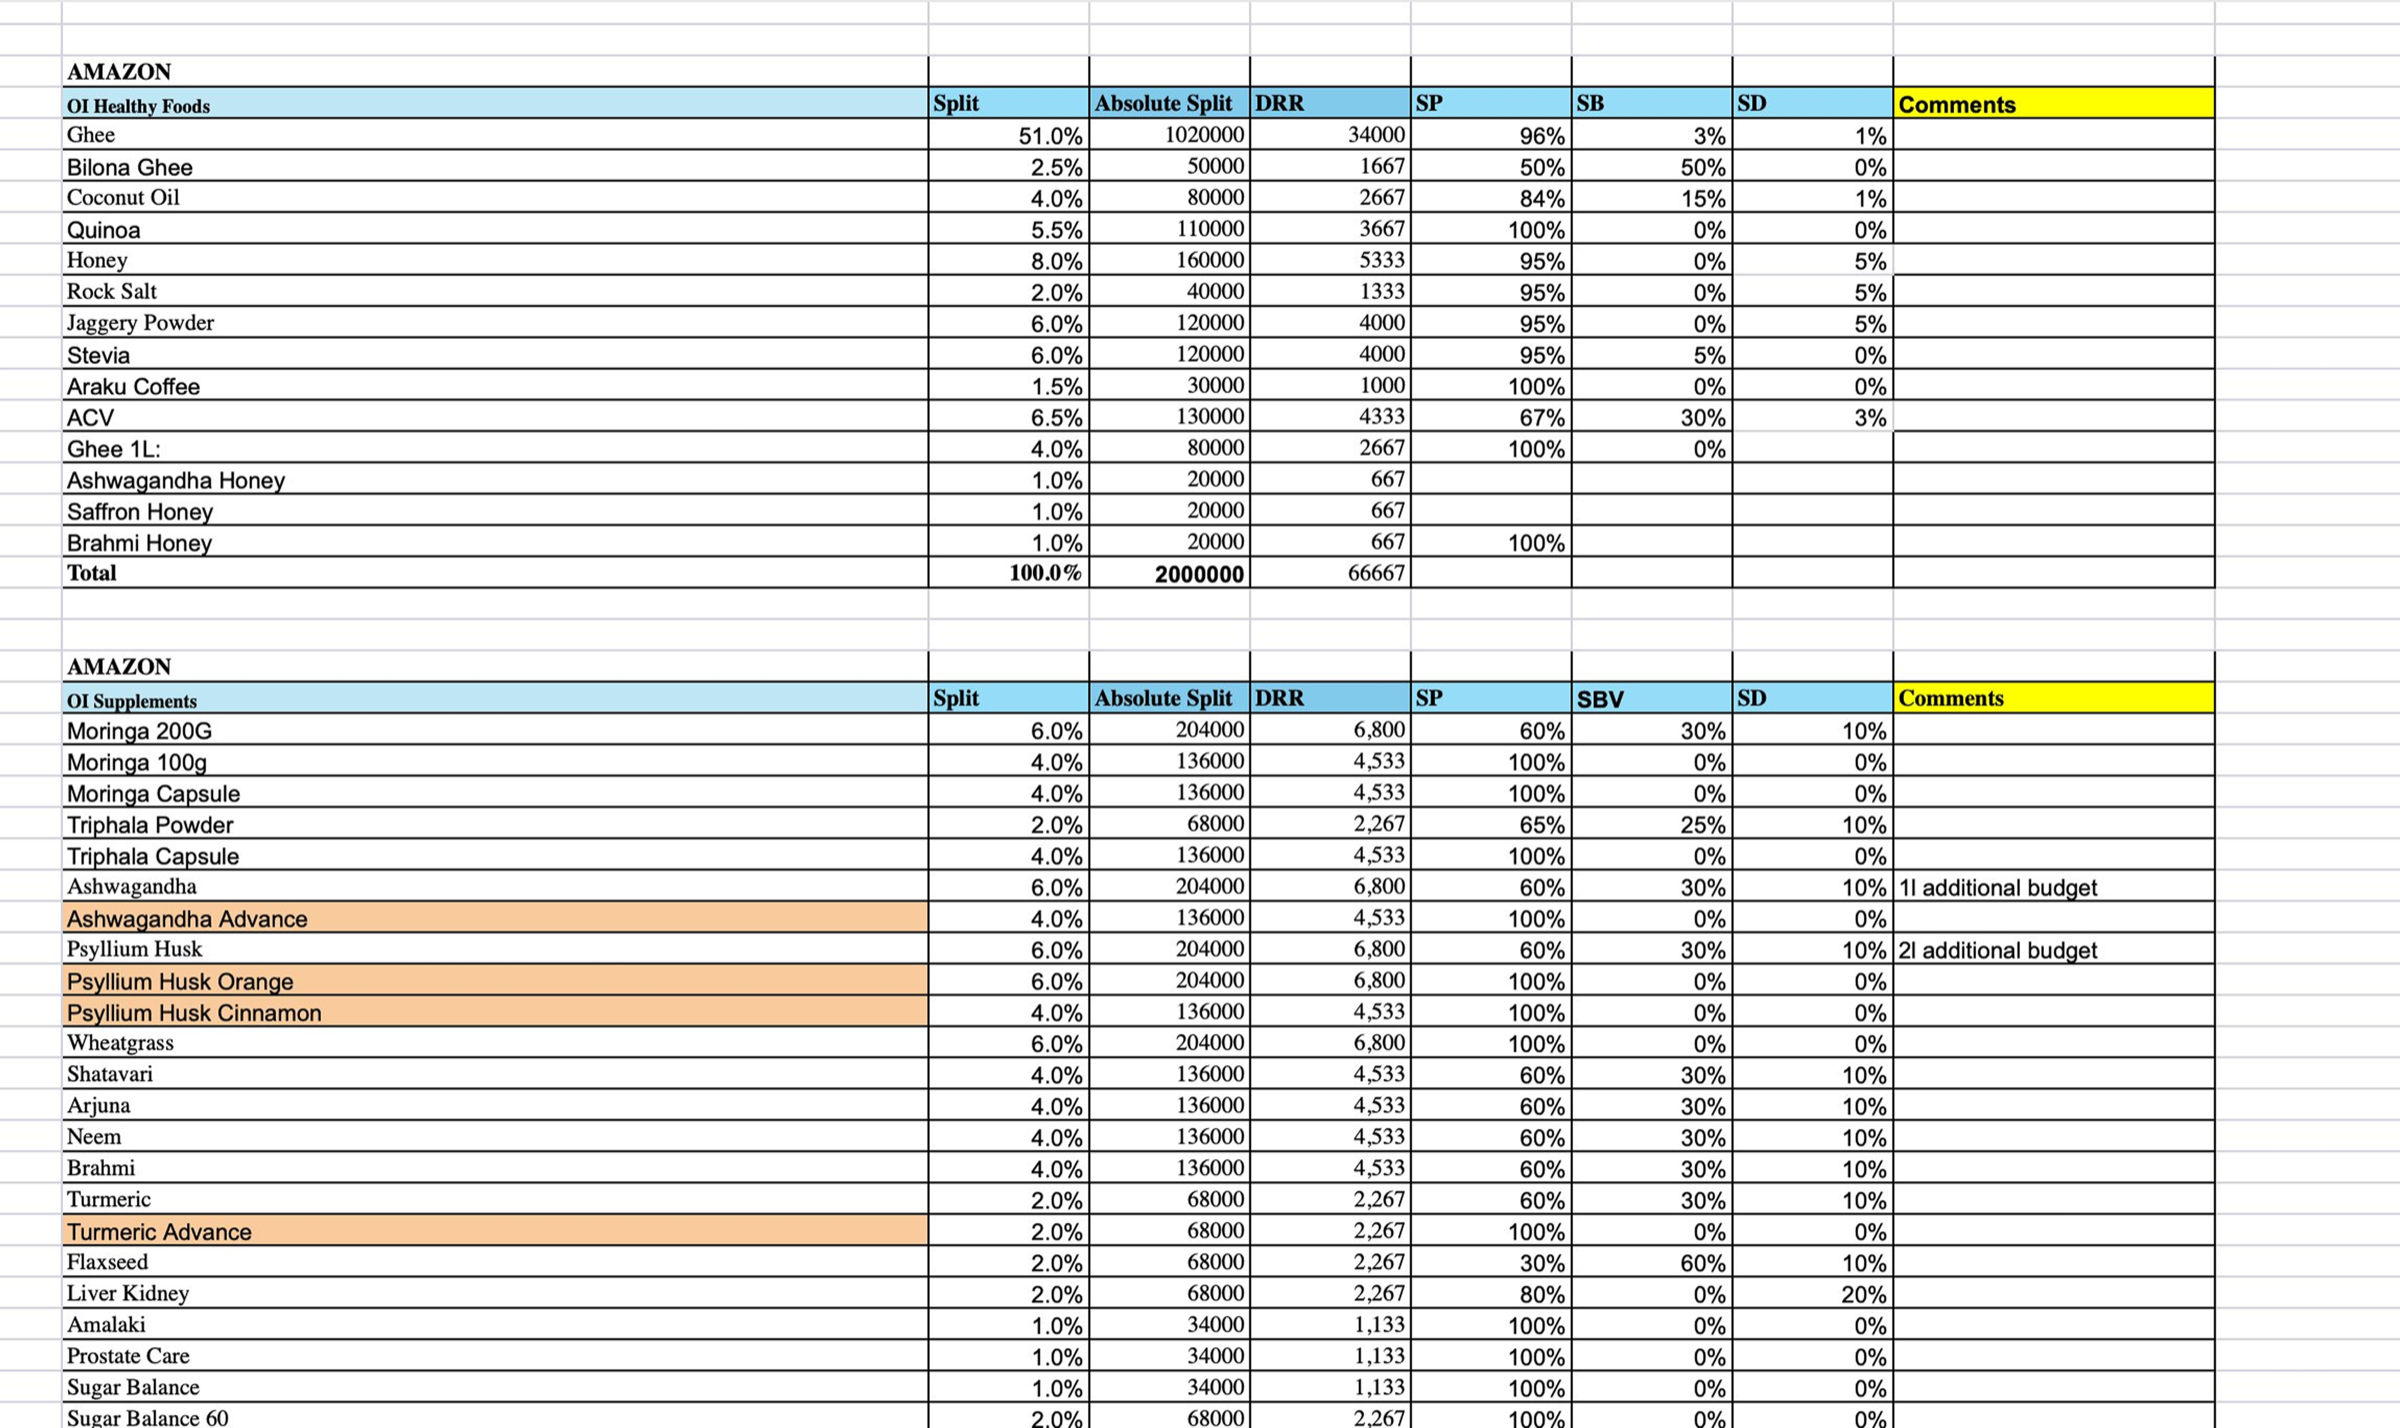
The manual process — budget splits, DRR, campaign type allocations tracked across dense Excel sheets, updated daily
Spend intelligence at a glance
At the start of the month, the manager inputs the monthly budget, target ROAS, and planned DRR for each portfolio. That's the baseline everything is measured against.
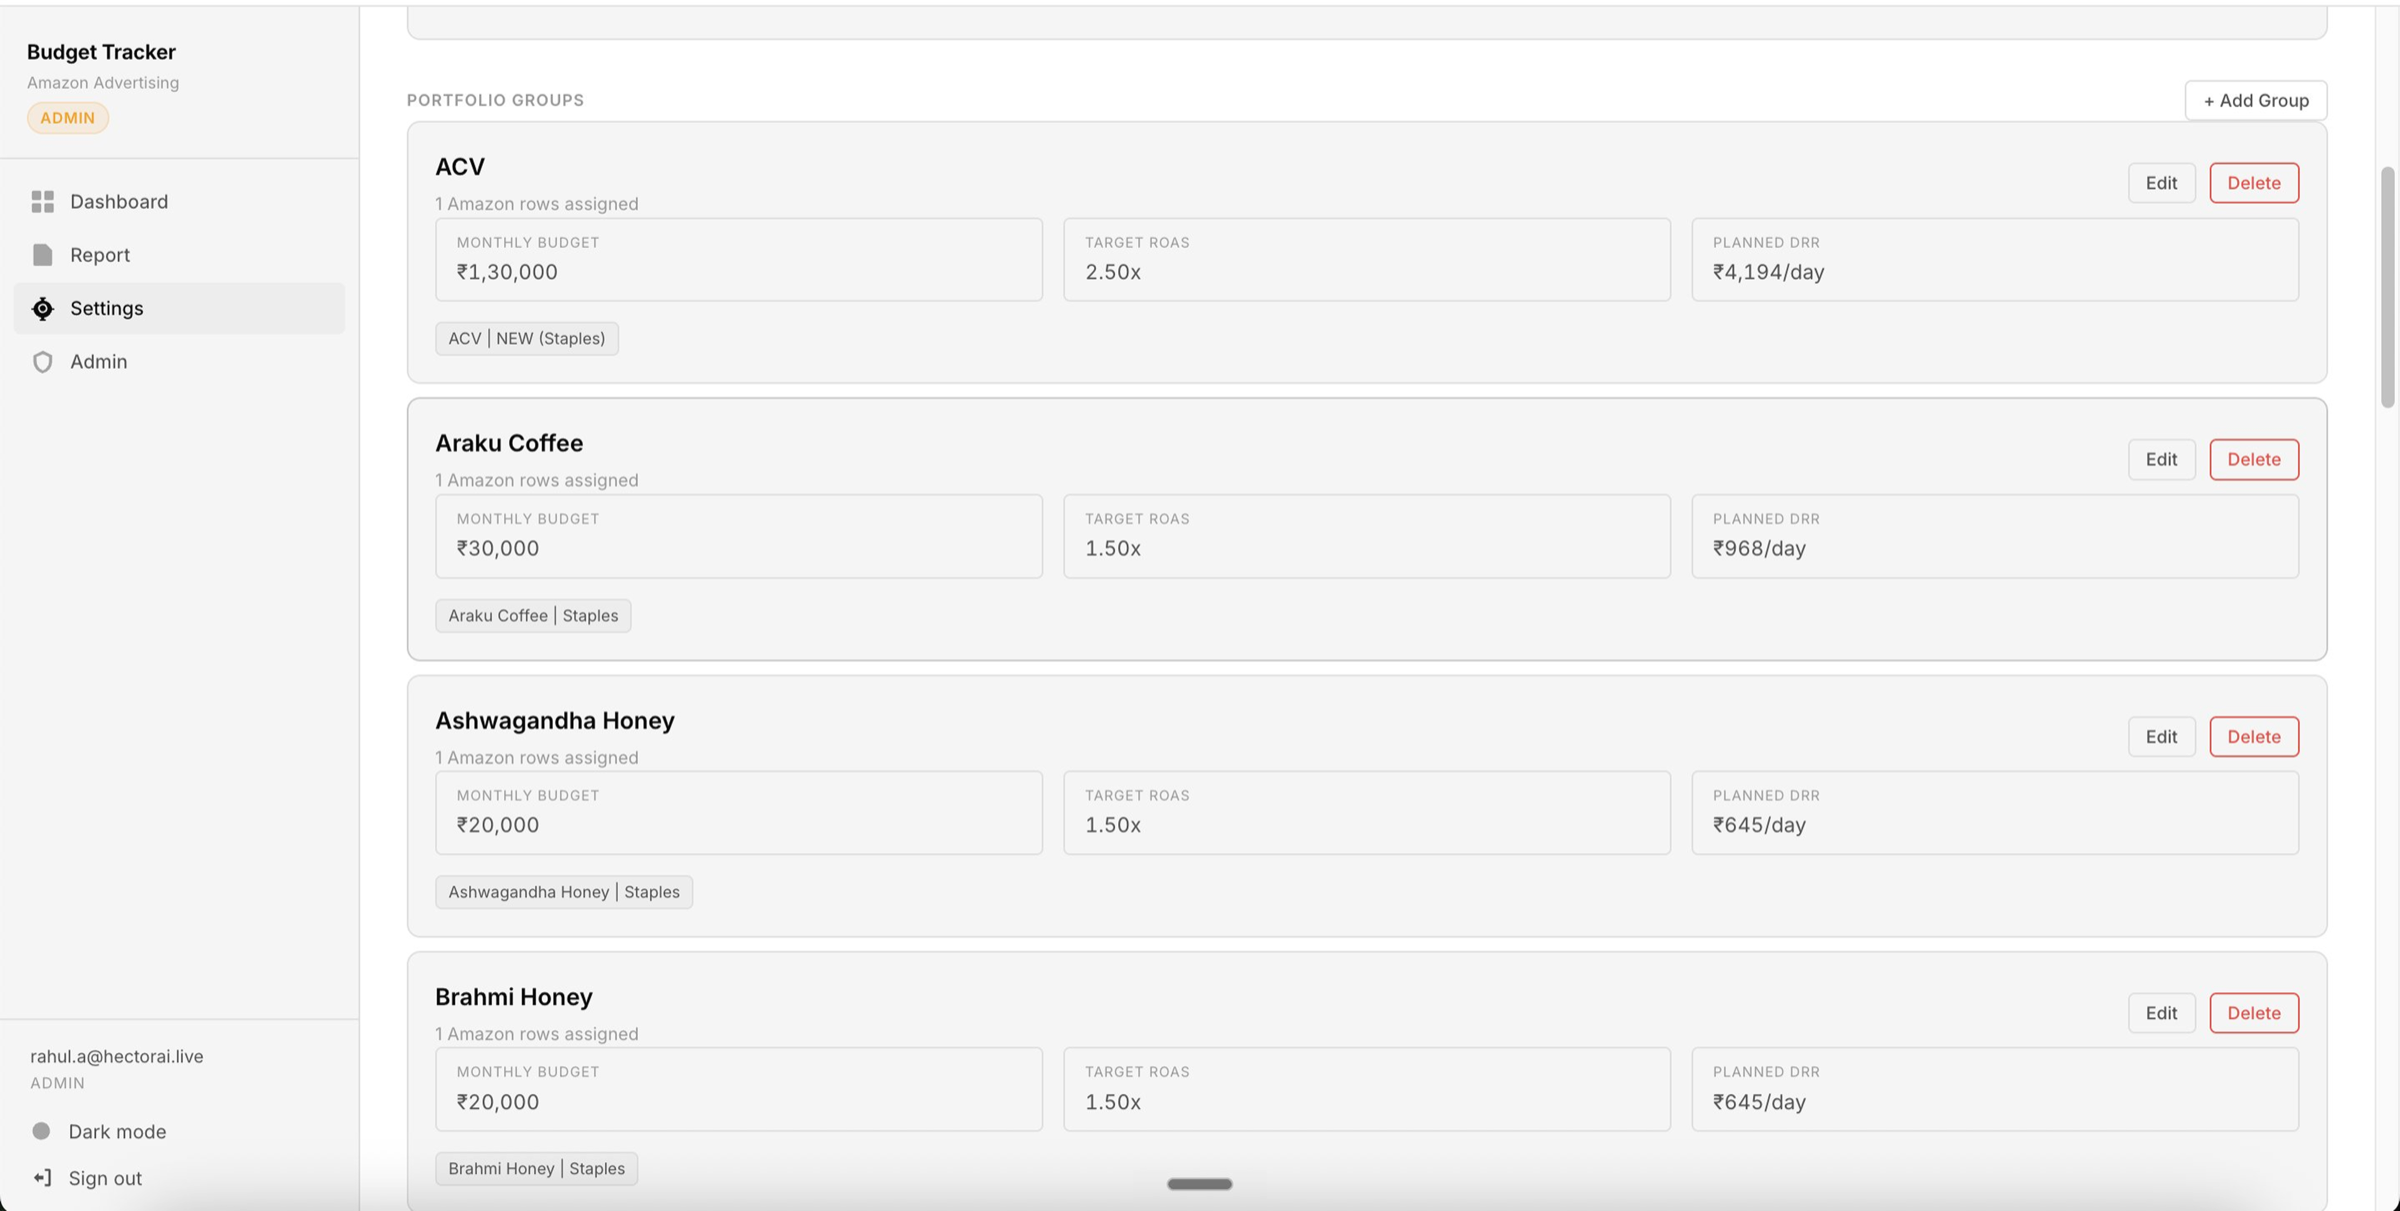
Settings — portfolio groups configured once at the start of each month
Once data is uploaded, the dashboard calculates actual MTD spend against target, flags where spend percentage is off track, shows actual ROAS vs target ROAS, and recalculates a revised DRR for the remaining days of the month. Color coding makes the status of every portfolio immediately readable — no formulas, no manual calculation.
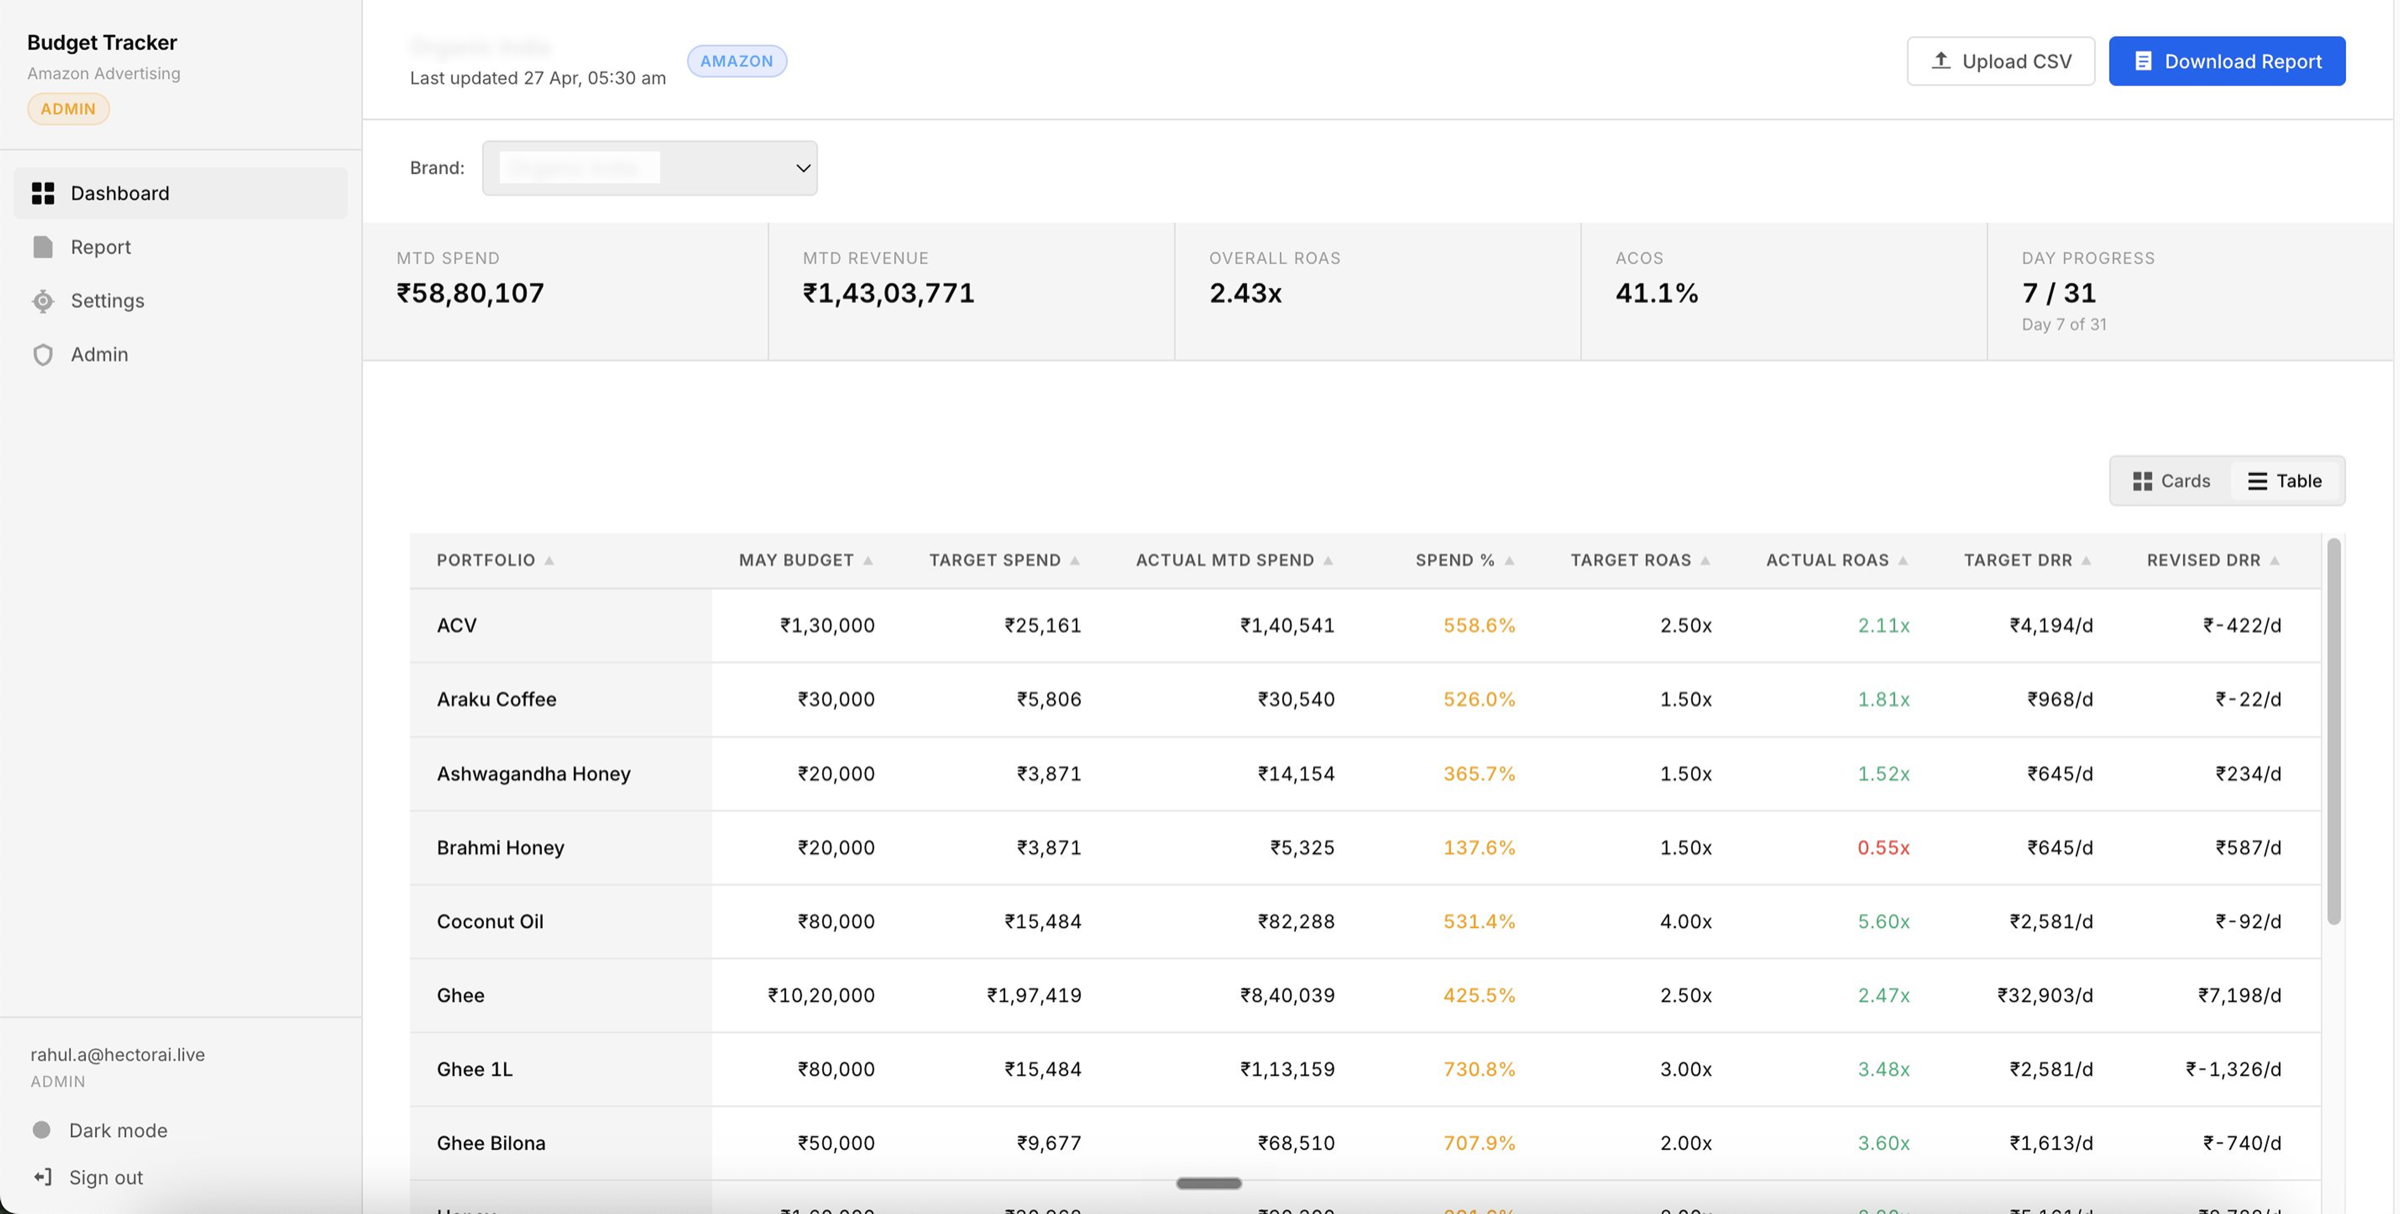
Dashboard — MTD spend vs target, actual vs target ROAS, revised DRR per portfolio — color-coded for immediate decision-making
The report builder from Act One is now integrated directly into the budget tracker. Once data is uploaded for budget tracking, the same data powers the POC scorecard generation — no separate upload, no context switching.
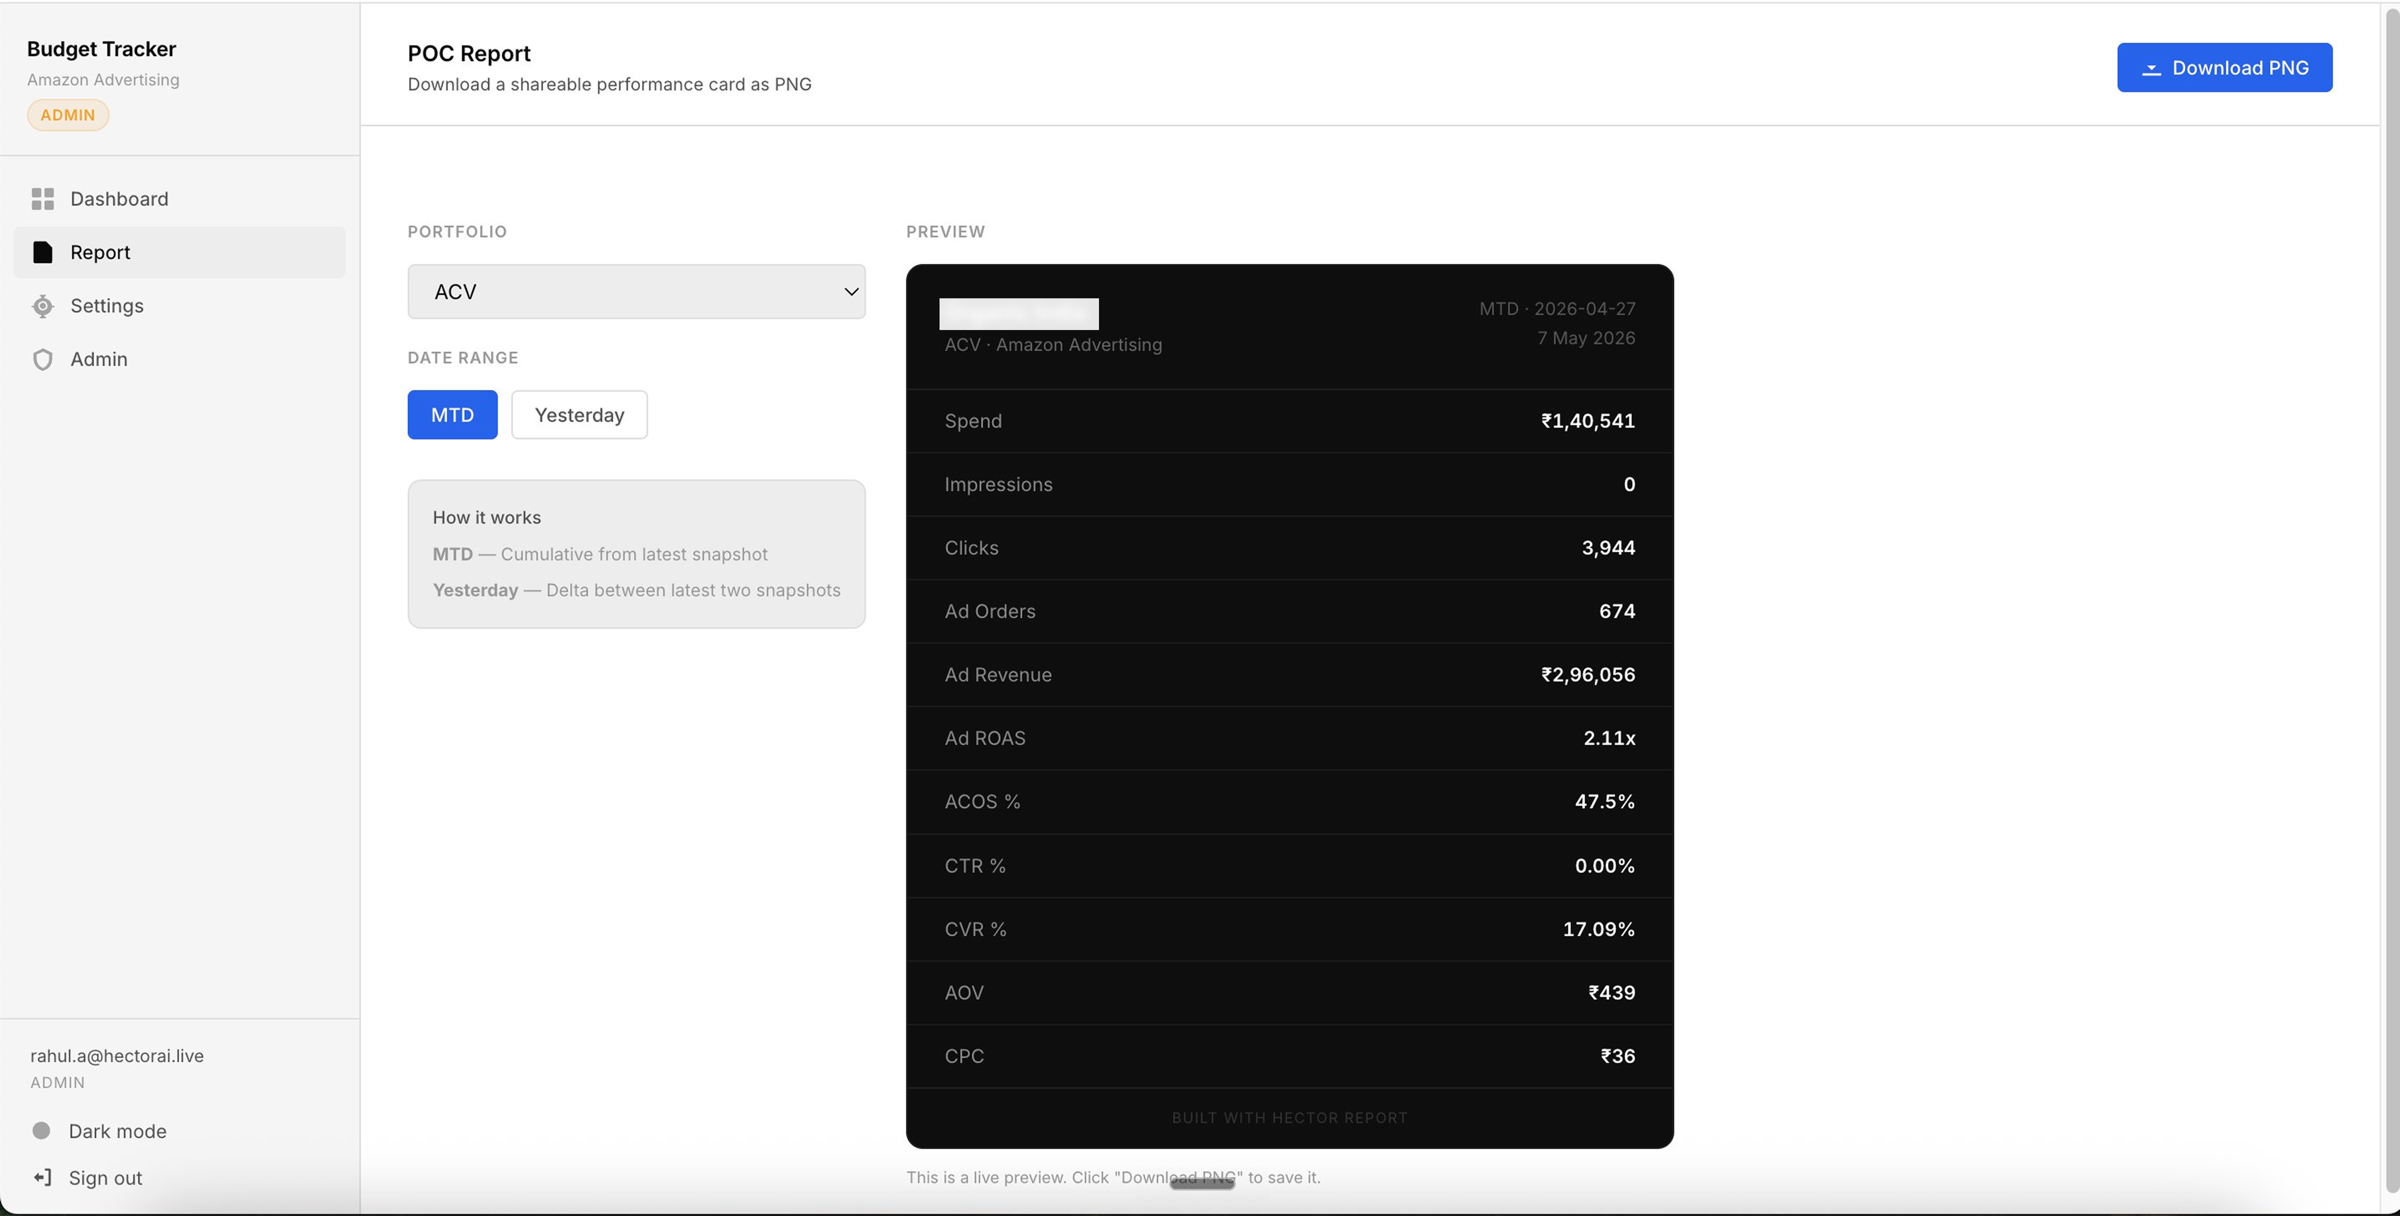
Integrated report section — select portfolio and date range, generate POC report directly from budget tracker data
The two tools are converging. What started as a scorecard generator is becoming the daily operating layer for performance marketers — the first thing opened each morning, before the main ad platform.
Active iteration. AI layer incoming.
The budget tracker is being built in direct collaboration with the colleague who uses it daily — features added based on real usage, not assumptions. The next planned layer is AI-driven suggestions: recognising patterns in a manager's spending behaviour and surfacing recommendations based on how specific portfolios have historically responded to budget changes.
The longer-term direction is for this tool to serve as the pre-flight check before the main Hector platform — giving performance marketers the spend and budget picture they need before diving into campaign-level optimisation.